-
2103 Room NO.322 Xinggang One Road,Haicang District,Xiamen Fujian,Kina


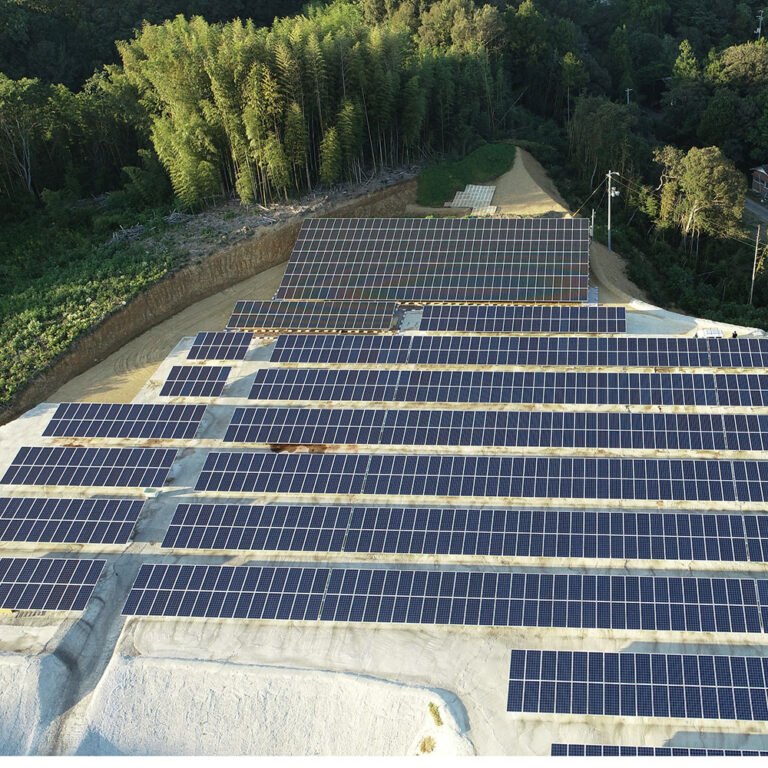
Solar Mounting System Structural Calculation Report
Project Name: XX Distributed Photovoltaic Project
Design Unit: XX New Energy Technology Co., Ltd.
Date: XX Month, 2025
1. Design Basis
- “Photovoltaic Power Station Design Code” (GB 50797-2012)
- “Steel Structure Design Standard” (GB 50017-2017)
- Local wind pressure and snow pressure data (from XX meteorological station)
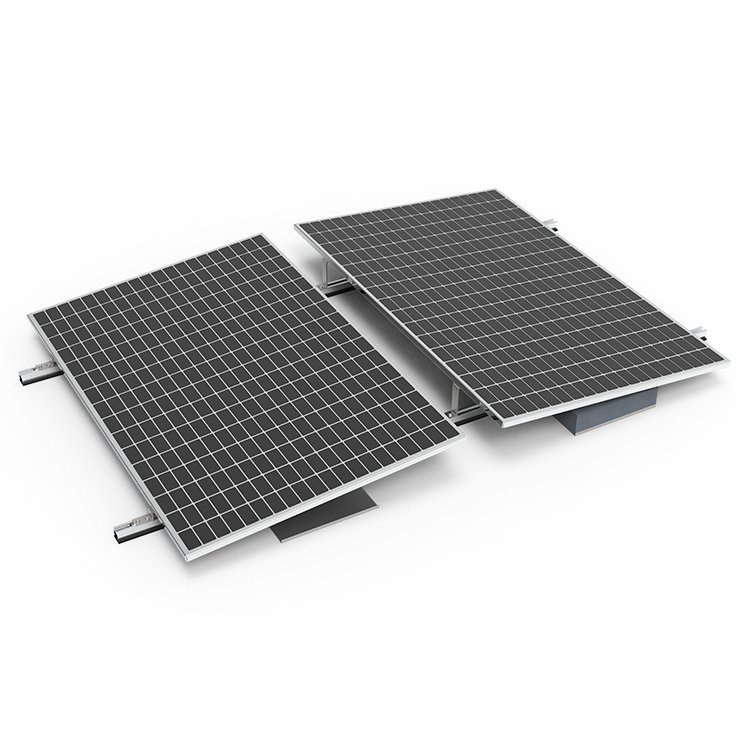
- Component Parameters: Monocrystalline silicon 550W, dimensions 2278×1134×30mm, weight 28.5kg/piece
2. Foundation Parameters
2.1 Environmental Condition Parameters
| Parameter | Value | Notes |
|---|---|---|
| Local Wind Pressure | 0.45 kN/m² | |
| Snow Pressure (50-year recurrence) | 0.30 kN/m² | Snow thickness estimated at 10 cm |
| Earthquake Intensity | 7 degrees | Basic design acceleration: 0.10g |
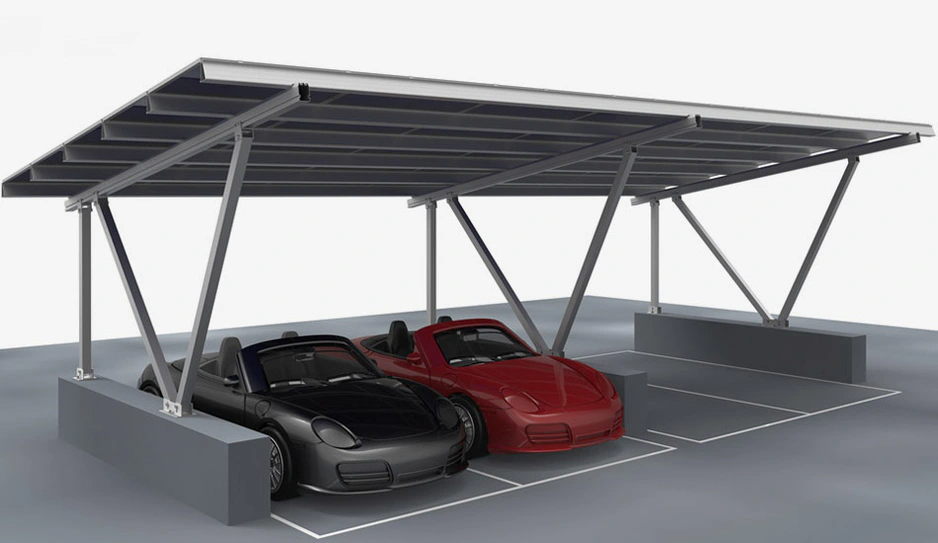
2.2 Mounting System Selection Comparison
| Type | Advantages | Disadvantages | Suitable Scenarios |
|---|---|---|---|
| Galvanized Steel Racks | High strength, 25-year lifespan | Heavy weight, high transport costs | Large ground-mounted systems |
| Aluminum Racks | Lightweight, corrosion-resistant | High cost, lower load capacity | Rooftop distributed systems |
| Concrete Ballast Blocks | No need for foundation, quick installation | Poor wind resistance | Flat, hardened ground surfaces |
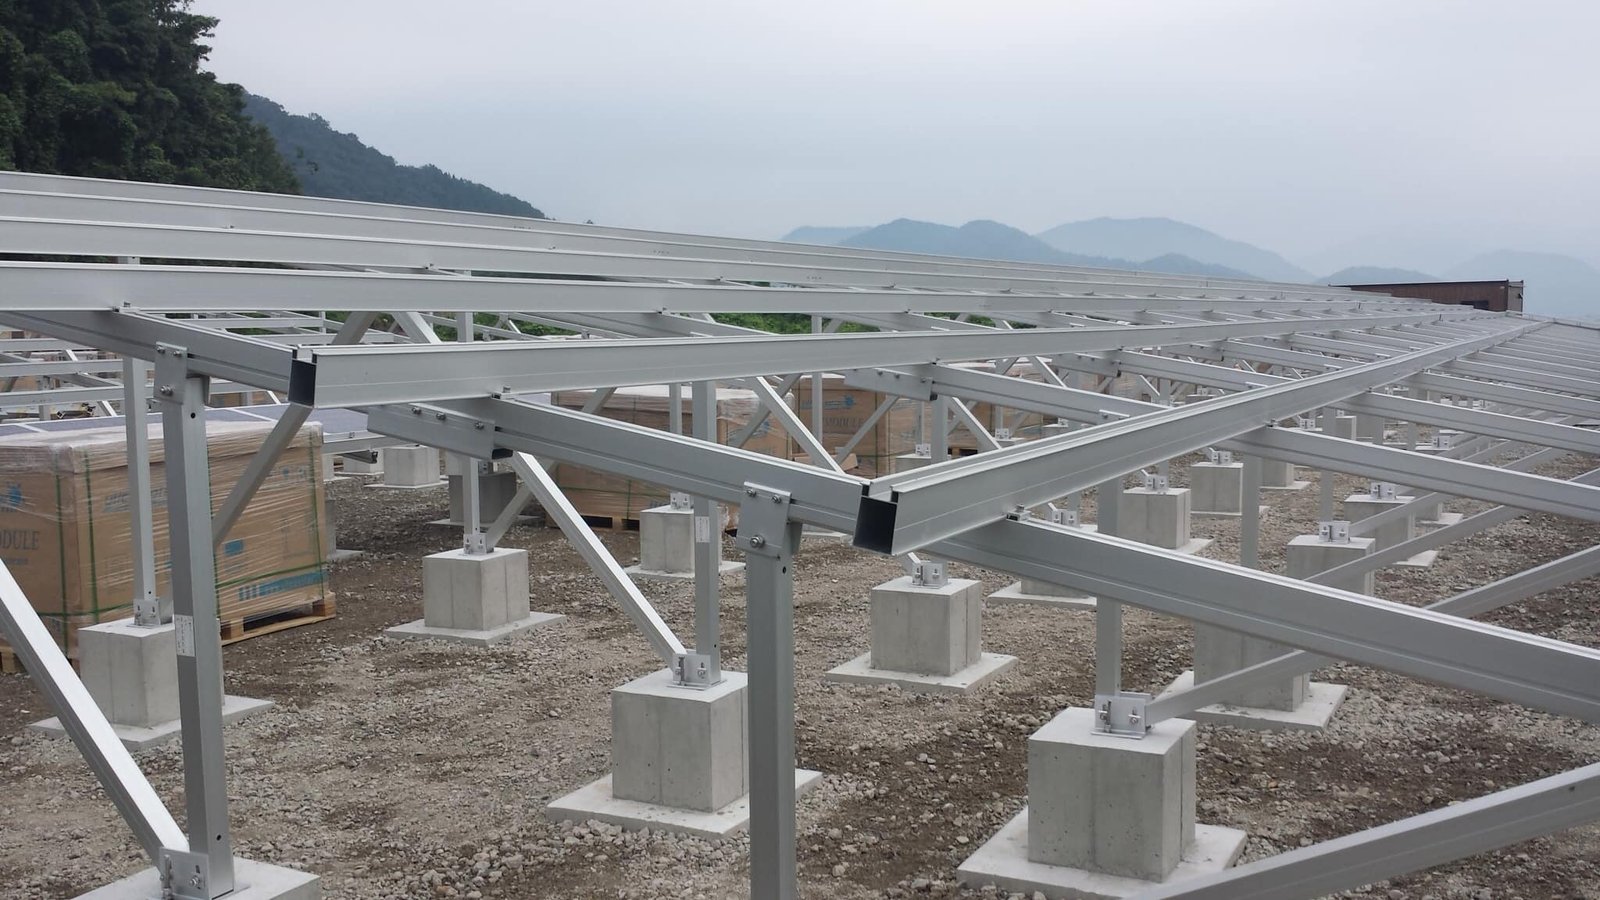
Chosen System: Galvanized Steel Racks (C-steel Q235B)
Reason: Lower cost, strong wind resistance.
3. Load Calculations
3.1 Dead Load (G)
- Module weight: 28.5 kg/piece × 20 pieces = 570 kg → 5.6 kN
- Rack weight: Estimated at 12 kg/m² → 1.2 kN
3.2 Live Load (Q)
- Wind Load (W): According to GB50009, Wk=βzμsμzW0W_k = \beta_z \mu_s \mu_z W_0
Where:- βz\beta_z (wind vibration coefficient) = 1.0
- μs\mu_s (shape factor) = 1.3 (for 25° module tilt)
- μz\mu_z (wind pressure height factor) = 1.0 (at 10m height)
- W0W_0 (basic wind pressure) = 0.45 kN/m²
Result: Wk=0.59kN/m2W_k = 0.59 kN/m²
- Snow Load (S): 0.30 kN/m²×1.0 (slope factor)=0.30 kN/m²0.30 \, \text{kN/m²} \times 1.0 \, (\text{slope factor}) = 0.30 \, \text{kN/m²}
3.3 Load Combinations
| Combination Type | Formula | Calculation Result (kN/m²) |
|---|---|---|
| Dead Load + Live Load | 1.2G + 1.4Q | 1.2 × 6.8 + 1.4 × 0.59 = 9.23 |
| Dead Load + Wind Load | 1.0G + 1.4W | 6.8 + 1.4 × 0.59 = 7.63 |
Control Condition: Dead Load + Live Load Combination (9.23 kN/m²)
4. Structural Verification
4.1 Purlin Calculation
- Selected: C80×40×15×2.0 Galvanized C-Steel
- Span: 2.5 m
- Moment: M=qL28=9.23×1.2×2.528=8.66 kN\cdotpmM = \frac{qL^2}{8} = \frac{9.23 \times 1.2 \times 2.5^2}{8} = 8.66 \, \text{kN·m}
- Bending Check: σ=MWx=8.66×10620.5×103=422 MPa>235 MPa\sigma = \frac{M}{W_x} = \frac{8.66 \times 10^6}{20.5 \times 10^3} = 422 \, \text{MPa} > 235 \, \text{MPa} ❌
Conclusion: Does not meet the requirement! Use C100×50×20×2.5 (with Wx=34.2×103 mm3W_x = 34.2 \times 10^3 \, \text{mm}^3, σ=253 MPa\sigma = 253 \, \text{MPa})
4.2 Column Stability
- Selected: 80×80×3.0 Square Pipe
- Slenderness Ratio: λ=Li=250031.3=79.8<150\lambda = \frac{L}{i} = \frac{2500}{31.3} = 79.8 < 150 ✅
- Axial Force: N=9.23×2.5×1.2=27.69 kNN = 9.23 \times 2.5 \times 1.2 = 27.69 \, \text{kN}
- Stability Factor: ϕ=0.68\phi = 0.68 (from tables)
- Verification: NϕA=27.69×1030.68×913=44.6 MPa<215 MPa\frac{N}{\phi A} = \frac{27.69 \times 10^3}{0.68 \times 913} = 44.6 \, \text{MPa} < 215 \, \text{MPa} ✅
5. Material List and Cost Comparison
| Material | Galvanized Steel Option | Aluminum Option | Savings Ratio |
|---|---|---|---|
| Main Beam (tons) | 3.2 | 1.8 | -43% |
| Purlin (tons) | 1.5 | 0.9 | -40% |
| Total Cost (¥10,000) | 8.5 | 12.0 | +41% |
Conclusion: The galvanized steel option is more cost-effective, but purlin reinforcement needs attention.
6. Grounding and Design Suggestions
- Rust Prevention: Galvanized layer thickness ≥ 80μm, with anti-rust paint on welds.
- Water Drainage: Purlins should have drainage holes to avoid water accumulation.
- Quick Installation: Pre-drill holes and use bolts to minimize onsite welding.
Approval:
- Designer: ______
- Reviewer: ______
Notes:
Actual construction may need to adjust the foundation type based on site soil reports (recommended screw piles or concrete foundations).
Key Takeaways: Quantitative Evaluation Method for Material Selection
In solar mounting design, balancing cost och performance requires data-driven decision-making to avoid subjective errors or overdesign. Below is a method for quantitative evaluation, covering key indicators, calculation models, and real-world case studies.
- Establishing a Quantitative Evaluation Indicator System
Decompose cost and performance into measurable indicators, assigning weights based on project needs. - Key Parameter Quantification
Example: Wind Pressure Resistance vs. Material Cost
Case Comparison:- Q235B Galvanized Steel (Strength 235 MPa, Price ¥5000/ton)
- Q355B Galvanized Steel (Strength 355 MPa, Price ¥5800/ton)
- Aluminum 6061 (Strength 310 MPa, Price ¥25000/ton)
Conclusion: Q355B steel offers the best cost-performance ratio, with 51% higher strength and just a 16% price increase.
- Sensitivity Analysis
Identify variables with the most impact on cost and performance, such as wind pressure and corrosion levels. - Final Decision Making
Use weighted scoring to compare materials based on the calculated cost-effectiveness and performance.
Summary: A well-designed solar mounting system relies on understanding both the cost och performance of materials.
By using data and careful analysis, you can avoid overdesign, meet local environmental requirements, and ensure that your system lasts for decades.